Currently Empty: $0.00

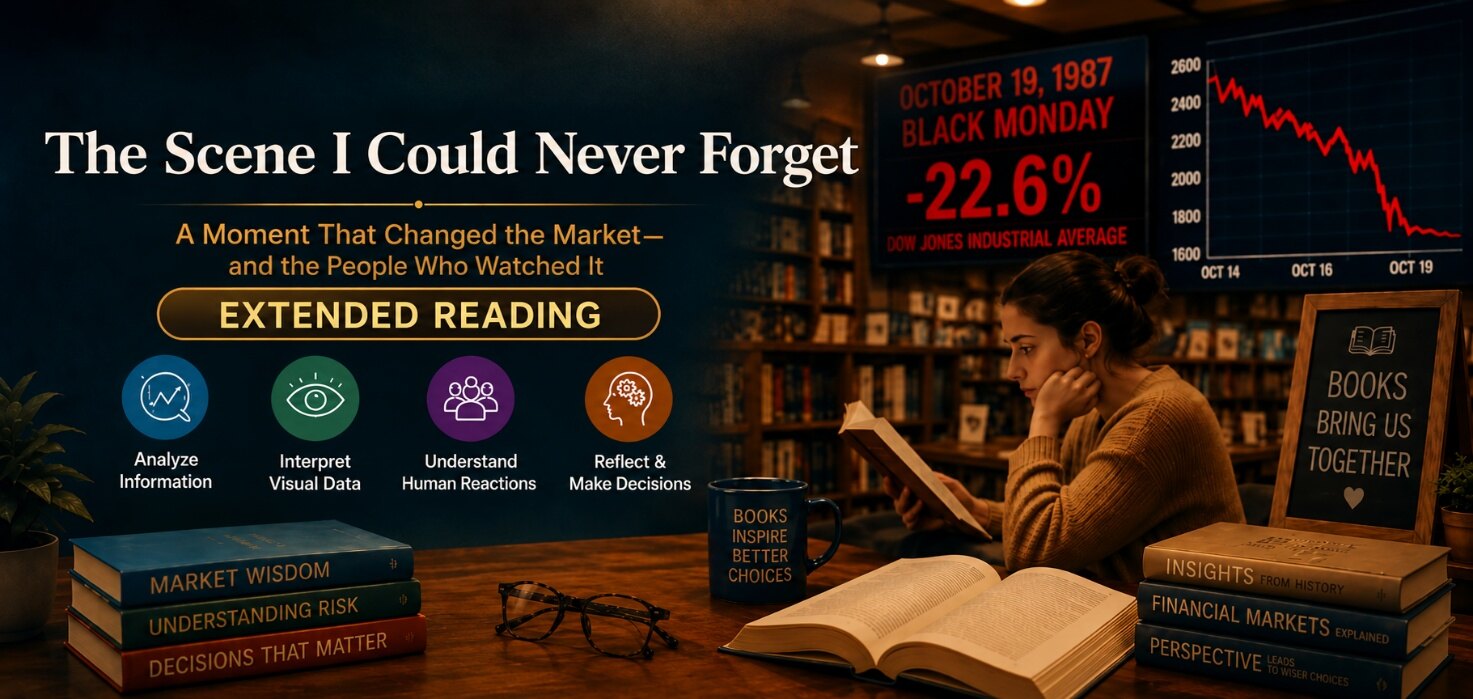
How can information help people make better decisions?
Genre: Analytical Text
Text Structure: Chronological Sequence and Visual Analysis
Sometimes numbers become more than numbers. They begin to represent uncertainty, fear, and decisions that may affect thousands of people. One such moment came on Black Monday, October 19, 1987, when stock markets worldwide experienced one of the most dramatic falls in modern financial history. For those watching the market that day, the changing figures on their screens created a scene that was difficult to forget.
In the days before Black Monday, the market had already begun to weaken. On October 14, the Dow Jones Industrial Average stood at approximately 2,413 points. It fell to about 2,355 points on October 15 and then to 2,247 points on October 16. These changes were considerable, but they did not prepare observers for what happened next. Historical records show that the market had already lost substantial ground from its August peak before the dramatic collapse.
On the morning of October 19, investors entered offices expecting another uncertain day. Instead, prices began falling rapidly. The atmosphere became increasingly tense as the figures changed from one moment to the next. By the end of the day, the Dow Jones had fallen to approximately 1,739 points, a decline of about 22.6 percent in a single day. It was the largest one-day percentage decline in the Dow’s history at that time.
The image of falling numbers is powerful because it immediately captures attention. A line moving sharply downward communicates a dramatic change even to someone who knows little about financial markets. However, the numbers do not tell the whole story. They show what happened, but they do not automatically explain why it happened or what would happen next.
The following days added another layer of uncertainty. On October 21, the index recovered to approximately 2,028 points, a substantial rise from the Black Monday close. Yet this recovery did not mean that the crisis had disappeared. By October 26, the index had fallen again to approximately 1,794 points. The figures therefore reveal a sequence of sharp decline, partial recovery, and renewed uncertainty rather than a simple movement in one direction.
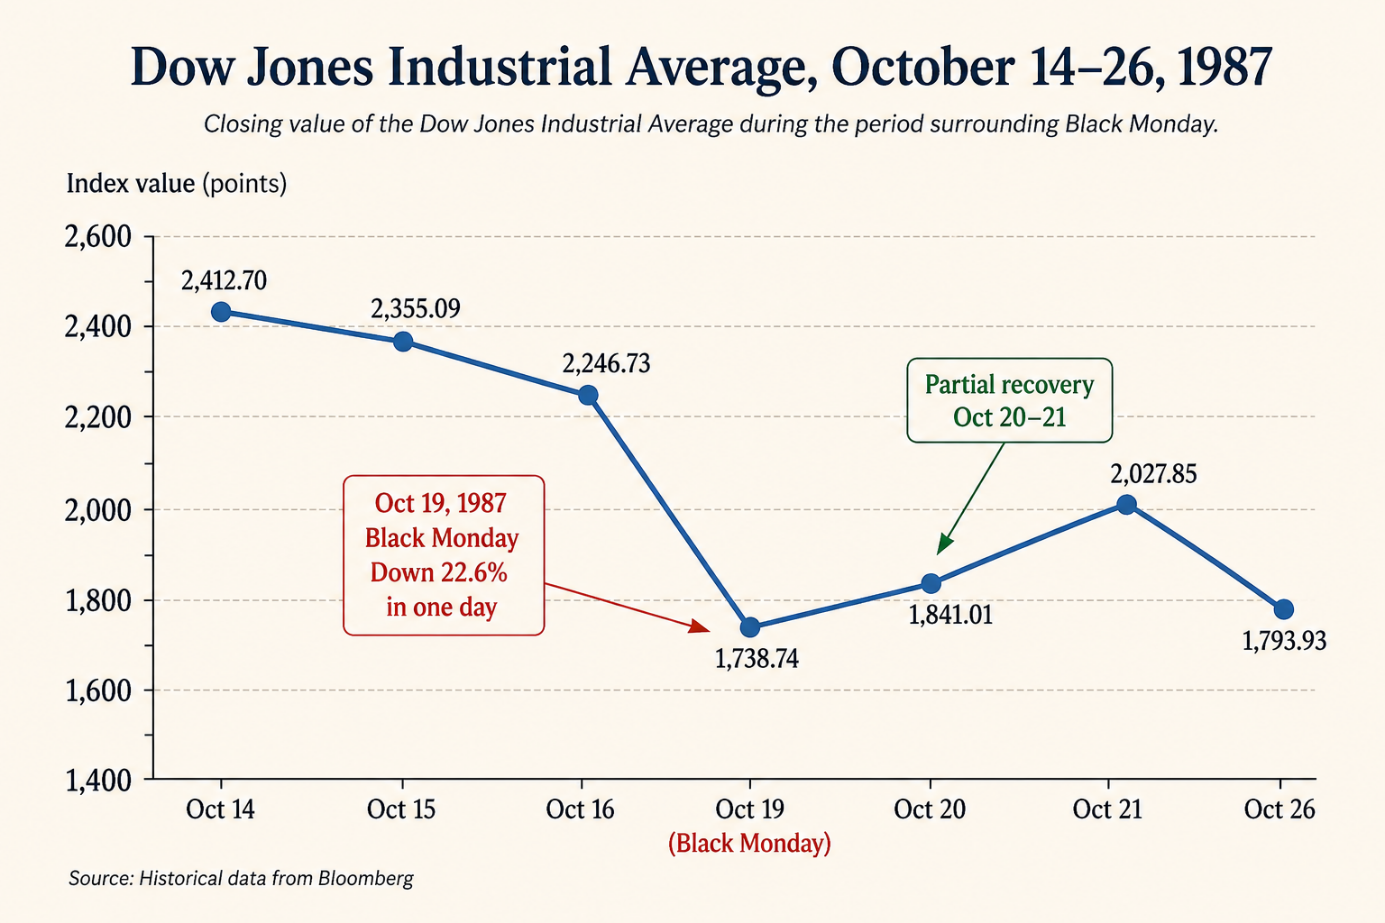
Dow Jones Industrial Average, October 14–26, 1987
For investors, interpreting this sequence was not easy. Some reacted quickly because they feared that prices would continue to fall. Others decided to wait, believing that selling during a dramatic decline could turn a temporary loss into a permanent one. Some may have viewed lower prices as an opportunity to buy. The same information could therefore lead different people to make different decisions.
This is an important lesson about information. Data does not always provide a clear answer. A falling number may indicate a serious problem, but it may also reflect temporary fear or the reactions of other investors. Someone who looks only at one day’s movement may reach a very different conclusion from someone who examines the wider trend.
A graph can make this difference easier to see. When the market figures from October 14 to October 26 are displayed on a line graph, the overall movement becomes immediately visible. The line moves downward before dropping dramatically on October 19. It then rises sharply before falling again. The graph helps viewers understand the scale of the change and the fluctuations that followed.
However, visual information also has limitations. A graph can demonstrate a trend, but it cannot tell us what every investor was thinking or identify every factor that influenced the market. To understand the situation, readers need to examine the evidence and consider the wider context.
The events of Black Monday also reveal the connection between information and emotion. Rapidly changing numbers can trigger fear and encourage people to act before they have considered all the available evidence. Confidence can also encourage people to take risks. Neither reaction necessarily represents careful decision-making. Good decisions require people to pause, examine reliable information, consider different explanations, and recognize what remains uncertain.
Looking back at the figures today, it may seem easier to understand the movement because we already know what happened. People watching the market in real time did not have that advantage. They had to make decisions while the situation was changing and while the outcome remained uncertain.
That is what makes the scene so memorable. The falling numbers were not simply statistics on a screen. They represented uncertainty, choices, and consequences. The event demonstrates that information can guide decisions, but it cannot make decisions for us. We still need judgment, perspective, and the ability to question our first interpretation.
Black Monday therefore offers a lasting lesson: information becomes valuable when people know how to interpret it. A graph can make a trend visible, numbers can provide evidence, and context can help explain what the evidence means. Together, these tools can support better decisions—but only when people use them carefully.