Currently Empty: $0.00

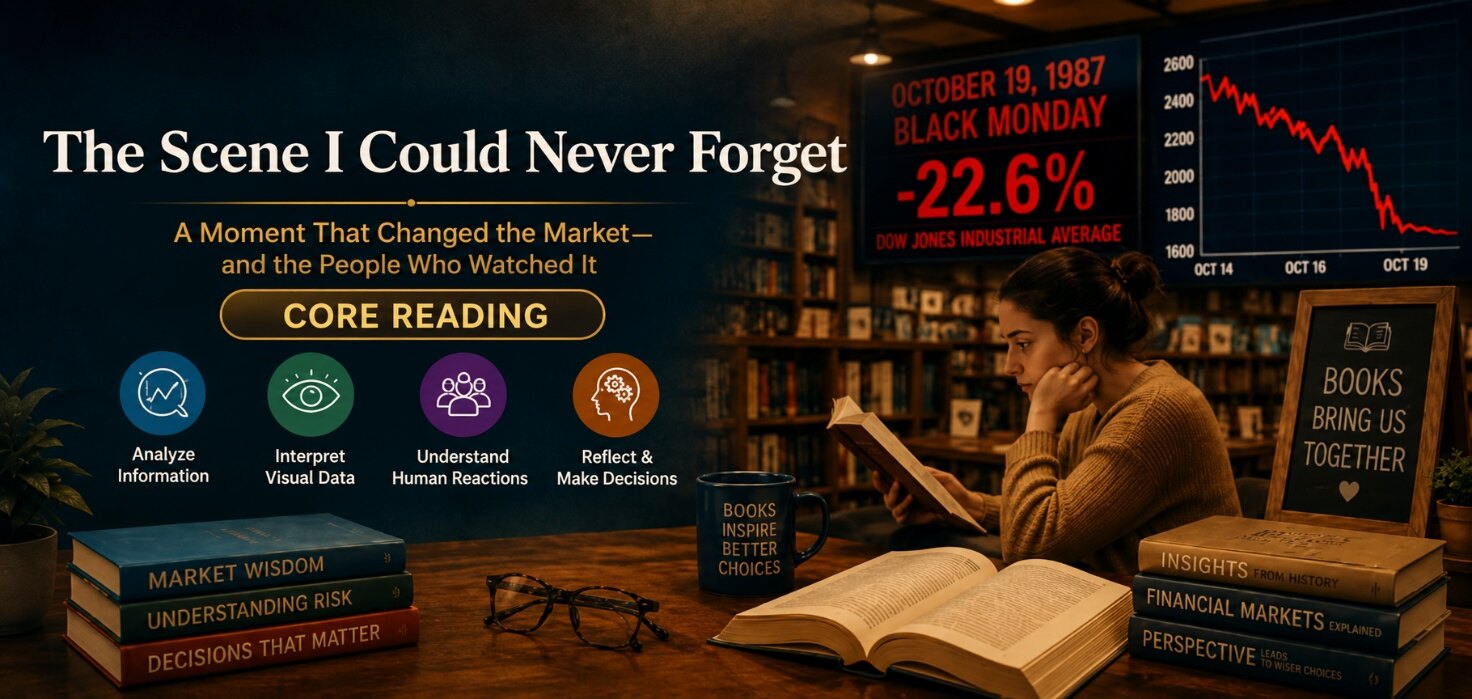
How can information help people make better decisions?
Genre: Analytical Text
Text Structure: Chronological Sequence and Visual Analysis
Main Reading Skill: Analyze Information in a Line Graph
On October 19, 1987, stock markets around the world experienced one of the most dramatic falls in modern financial history. The day became known as Black Monday. For people watching the market, the rapidly changing numbers created a scene that was difficult to forget.
The market had already begun to weaken before Black Monday. On October 14, the Dow Jones Industrial Average stood at 2,412.70 points. It fell to 2,355.09 on October 15 and 2,246.73 on October 16. These figures show that the market had already experienced substantial losses before the major fall.
On October 19, prices fell rapidly. By the end of the day, the Dow Jones had dropped to 1,738.74 points. This was a decline of about 22.6 percent in one day. The falling numbers clearly indicate how serious the change was.
However, the decline was not the end of the story. On October 20, the index recovered to 1,841.01 points. On October 21, it rose further to 2,027.85 points. This partial recovery did not mean that the crisis was over. By October 26, the index had fallen again to 1,793.93 points. The figures show a sequence of decline, partial recovery, and another fall.
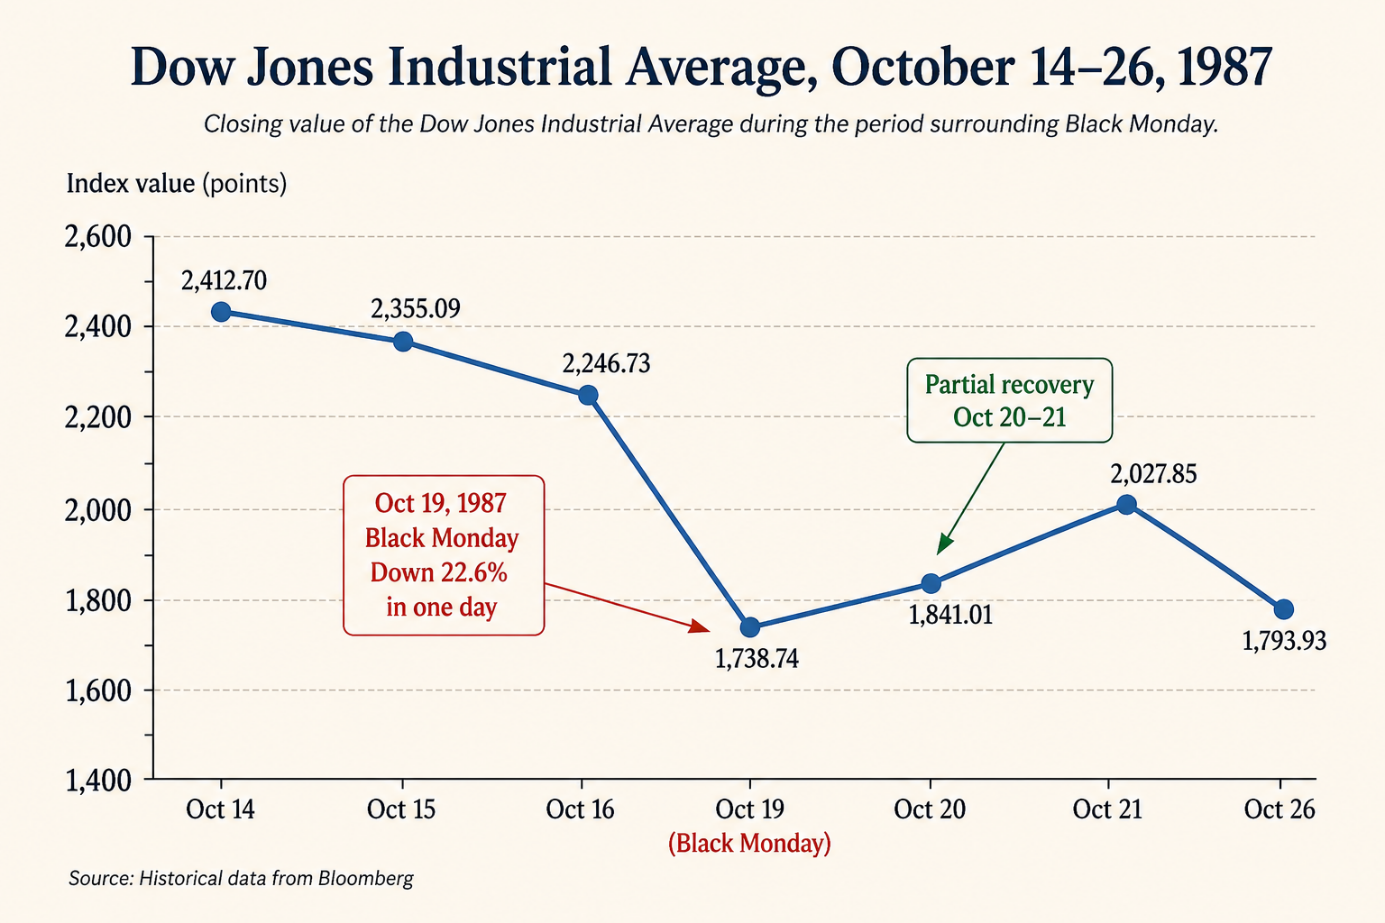
Dow Jones Industrial Average, October 14–26, 1987
The line graph makes this pattern easier to see. The line moves downward from October 14 to October 16 and then falls sharply on October 19. It rises during the next two days before falling again. These fluctuations show that the market did not move in only one direction.
A graph can demonstrate changes and help people recognize an overall trend. However, it cannot explain everything. The graph shows what happened to the market, but it does not explain every reason for the changes or tell us what would happen next.
This uncertainty affected people’s decisions. Some investors sold because they feared that prices would continue to fall. Others waited because they believed the market might recover. The same information could therefore lead people to make different decisions.
Black Monday shows why people need to interpret information carefully. Numbers and graphs can provide useful evidence, but good decisions require more than looking at one figure or one day. People need to examine the wider pattern, consider the context, and recognize what remains uncertain.